
Why Your Store Has Great ROAS But Still Loses Money
By Ashish Rai, CEO, Purple Circle · Updated August 2026 · 11 min read
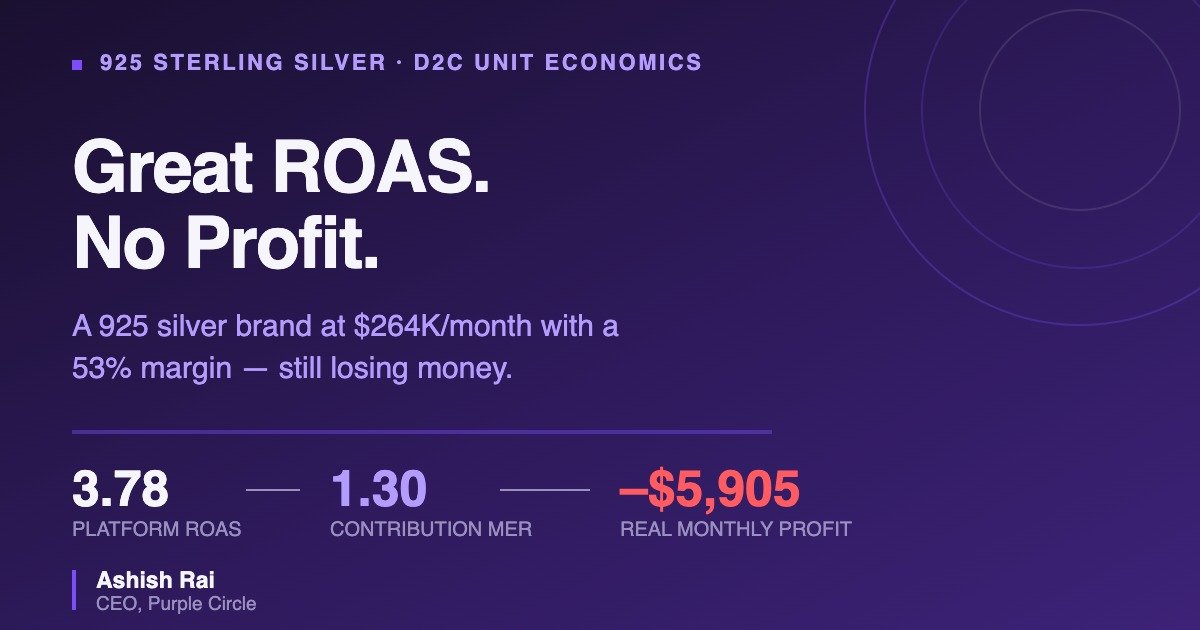
Short answer: ROAS measures revenue against ad spend. It knows nothing about your product cost, shipping, payment fees, discounts, or returns. A store can report a 3.6 ROAS on Meta, run a 53% contribution margin, and still lose money every month — because ROAS was built to grade an ad account, not a business.
Below is that exact case, worked end to end on a US sterling silver jewelry brand doing $264,000 a month.
The store that looks healthy
A 925 sterling silver jewelry brand. US-based, sells direct through Shopify, no wholesale.
| Metric | Value |
|---|---|
| Monthly revenue (Shopify gross sales) | $264,000 |
| Orders | 3,000 |
| Average order value | $88 |
| Total monthly ad spend | $88,000 |
| Return rate | 12% |
| Fixed monthly overhead | $32,000 |
Ad spend splits across three channels, and each reports back:
| Channel | Spend | Reported ROAS | Revenue claimed |
|---|---|---|---|
| Meta | $60,000 | 3.6 | $216,000 |
| $22,000 | 4.8 | $105,600 | |
| TikTok | $6,000 | 1.9 | $11,400 |
| Total | $88,000 | 3.78 | $333,000 |
The platforms claim $333,000 in revenue. The store made $264,000.
They have claimed $69,000 that does not exist — a 26% overstatement. Nobody is cheating. The same order gets claimed twice: a woman sees a Meta ad for a herringbone chain on Tuesday, searches your brand name Thursday, clicks a Google ad, and buys. Meta counts it. Google counts it. Your bank counts it once.
That is the first crack. It is not the one that costs you money.
Where an $88 sterling silver order actually goes
Jewelry has genuinely good margins. That is what makes this case instructive — the problem is not a bad product.
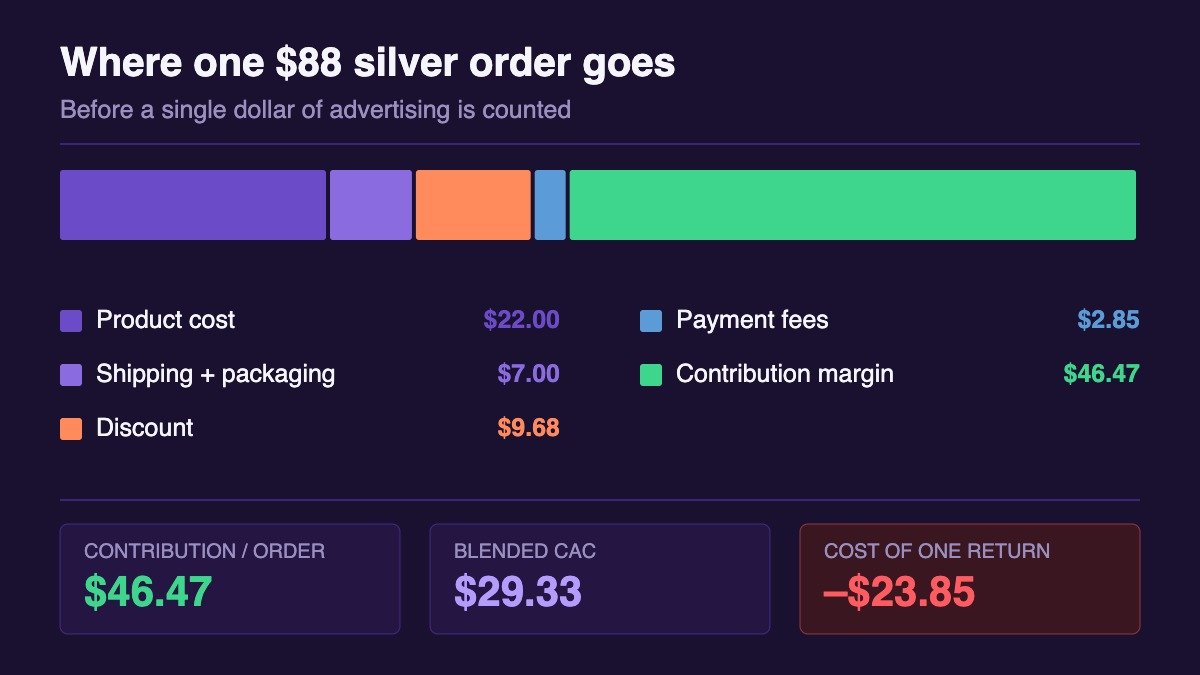
| Line | Amount |
|---|---|
| Average order value | $88.00 |
| Product cost (25%) | −$22.00 |
| Shipping, insured mailer, gift box | −$7.00 |
| Payment processing (2.9% + $0.30) | −$2.85 |
| Blended discount (11%) | −$9.68 |
| Contribution per order | $46.47 |
That is a 52.8% contribution margin. In apparel you would be thrilled with 35%. This store is doing well on product economics.
Blended CAC is $88,000 ÷ 3,000 = $29.33 per order.
So each order contributes $46.47 and costs $29.33 to acquire, leaving $17.14. Across 3,000 orders that is $51,420 a month before overhead. Comfortable.
Except returns have not been counted yet.
Why returns cost far more than the refund
This is the number most jewelry owners never run, and it is the one that decides the month.
A returned order does not cancel out to zero. You already spent the acquisition cost. You already shipped it. Now you pay again to bring it back.
| Cost on one returned $88 order | Amount |
|---|---|
| Product value not recovered (tarnish, sizing, scratched pieces sold at markdown) | −$4.00 |
| Outbound shipping and packaging, already spent | −$7.00 |
| Payment processing (most processors keep some or all of the fee) | −$2.85 |
| Return shipping | −$6.00 |
| Inspection, polishing, re-carding, restocking | −$4.00 |
| Total cost per returned order | −$23.85 |
The polishing and re-carding line is specific to this category and routinely missed. A returned silver piece cannot go back on the shelf the way a returned t-shirt can. Somebody handles it.
Now run the month:
- 2,640 kept orders × $46.47 = $122,681
- 360 returned orders × −$23.85 = −$8,586
- Net contribution margin: $114,095
Against $88,000 of ad spend, that is a contribution MER of 1.30. For every dollar of marketing, $1.30 of gross profit came back.
Then $32,000 of overhead — rent, salaries, software, 3PL storage, your own pay — comes out of $26,095.
Net result: a loss of $5,905 for the month.
The ladder: one store, six correct answers
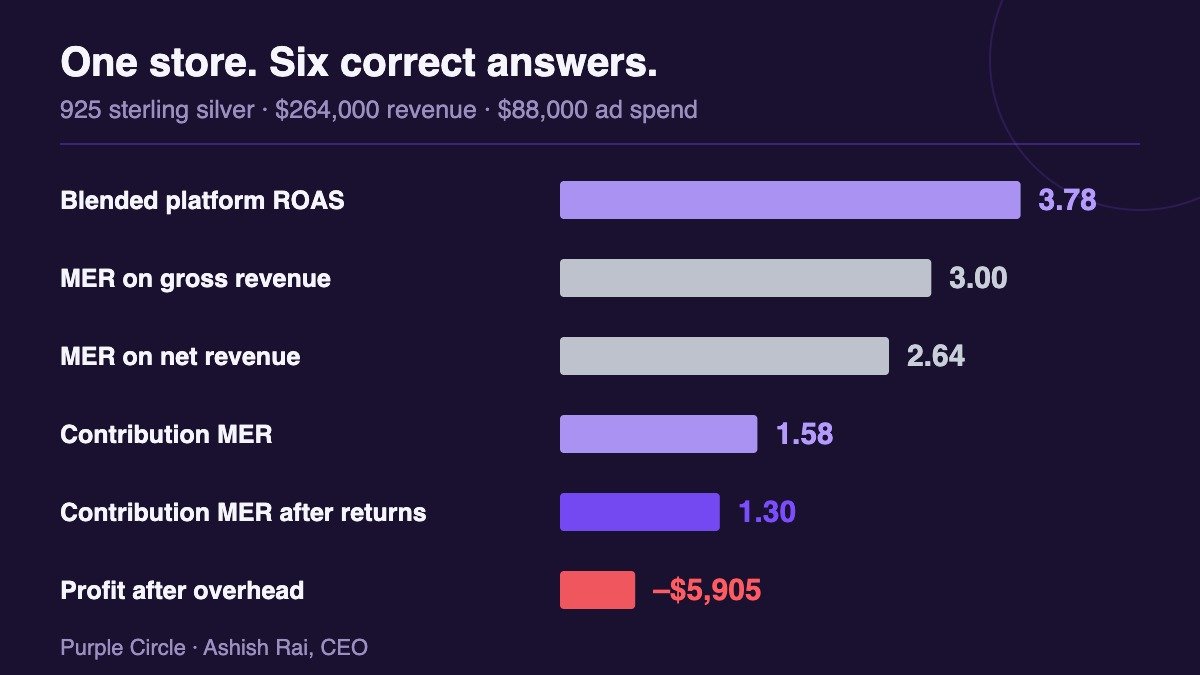
| Metric | Value | What it knows about |
|---|---|---|
| Blended platform ROAS | 3.78 | Nothing but ad spend and attributed revenue |
| MER on gross revenue | 3.00 | Real revenue, no costs |
| MER on net revenue | 2.64 | Refunded orders removed |
| Contribution MER | 1.58 | COGS, shipping, fees, discounts |
| Contribution MER after returns | 1.30 | The true cost of a 12% return rate |
| Profit after overhead | −$5,905 | Everything |
Every number in that table is arithmetically correct. The one at the top gets reported in the weekly deck. The one at the bottom is what shows up in the bank.
The gap between them is not a tracking problem you can fix with better attribution software. It is the difference between a channel metric and a business metric.
What ROAS, MER, and contribution MER each actually measure
Platform ROAS — revenue a single ad platform believes it caused, divided by that platform’s spend. It cannot see your other channels and cannot see a single one of your costs. Useful for comparing this week’s Meta performance to last week’s Meta performance. Not useful for anything else.
Blended ROAS — the platforms’ claims added together. Worse than useless, because it bakes the double-counting straight in. If someone reports this number to you, that is a red flag.
MER (Marketing Efficiency Ratio) — total store revenue divided by total marketing spend across everything: ads, agency fees, influencer payments, creative production. One revenue number instead of three competing claims. This is your weekly leadership metric.
Contribution MER (sometimes aMER) — contribution margin divided by total marketing spend. It accounts for COGS, fulfillment, discounts, and returns. This is the one that tracks cash.
The rule underneath all of it: any revenue figure that comes from an ad platform is a claim. Any revenue figure that comes from your Shopify payouts or your bank is a fact. Build reporting on the second kind.
The most expensive line on your website
Look at that cost table again. The single largest controllable cost in the stack is not shipping and it is not product. It is the $9.68 discount — the welcome popup offering 20% off a first order.
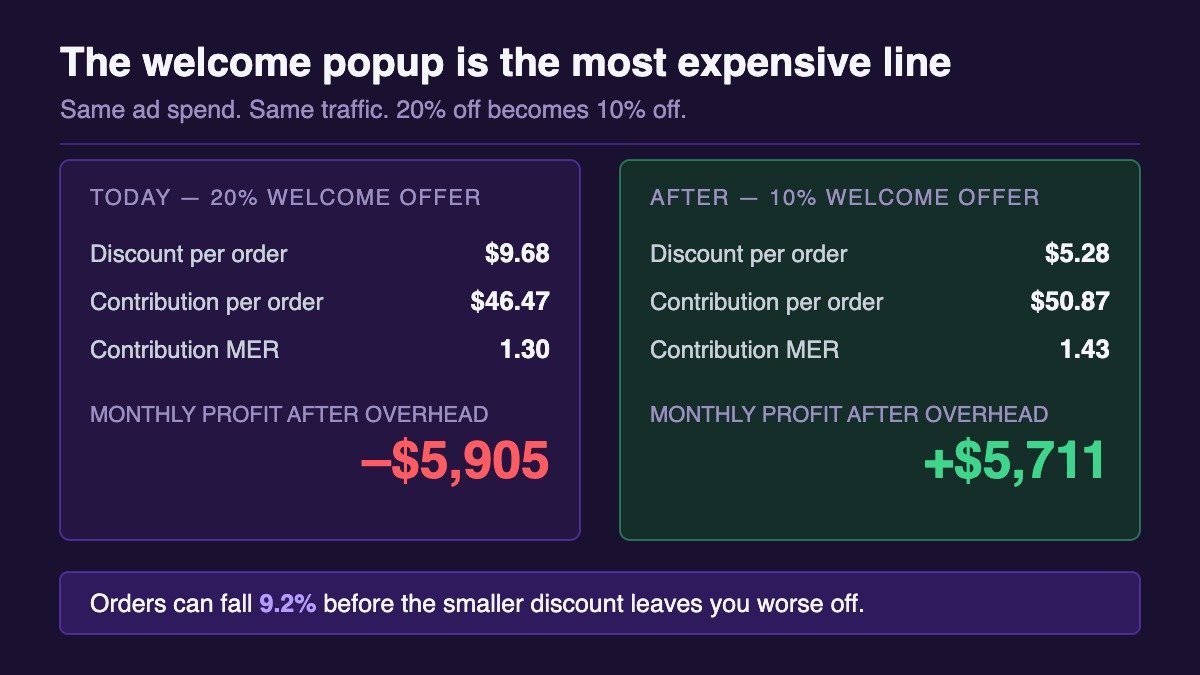
Cut the welcome offer from 20% to 10% and the blended discount rate falls from 11% to about 6%. Contribution per order rises from $46.47 to $50.87. Contribution MER moves from 1.30 to 1.43.
If order volume held, that is $11,616 more contribution a month — a $5,905 loss becomes a $5,711 profit. Same ad spend, same traffic, same creative.
But order volume will not hold, and pretending otherwise is how people lose money running this test. A smaller welcome offer converts worse. The honest question is: how much worse can it get before you are no better off?
The answer, for this store: orders can fall 9.2% — from 3,000 to 2,723 — before the smaller discount leaves you worse than today.
That is a real number you can test against. Run it for three weeks, watch order volume, and if the drop stays under 9%, keep the change. If it goes past that, you have learned something real about your price elasticity instead of guessing.
Two things to watch while testing. Ad spend stays fixed in this model, so fewer orders means a higher CAC — check both. And a 20% welcome discount trains customers to wait for a code, which quietly suppresses full-price repeat purchases for months after the first order.
How to run this on your own store
Not weekly. Once, properly, in a spreadsheet.
Use a rolling 90-day window. Refunds landing this month mostly belong to orders placed 30 to 60 days ago. On a single-month view the timing does not line up, and you will chase noise.
Pull six columns: gross revenue, refunds, COGS, shipping and fulfillment, payment processing and discounts, total marketing spend. Most of it comes out of Shopify’s finance reports in about an hour.
Then calculate your breakeven contribution MER. For this store, contribution after returns is 43.2% of gross revenue. To cover $88,000 of ad spend plus $32,000 of overhead, it needs $120,000 of contribution — which means gross revenue of $277,800, or a gross MER of 3.16 against the 3.00 it is running.
That is the actual gap. Not “improve ROAS.” A specific number, 0.16 of MER, with two ways to close it: sell more efficiently, or raise the 43.2%.
The second is usually easier. Nothing in the ad account produces a $11,600 monthly swing from one change.
A few technical notes worth knowing
Attribution windows. Meta’s default is 7-day click, 1-day view. A view-through conversion means someone saw your ad, did not click, and bought within 24 hours — Meta claims that order, and so does the email that actually drove it. Check the window setting before comparing any two periods. Plenty of “performance improvements” are window changes.
Modeled conversions. Since iOS 14.5 and ATT, a meaningful share of iOS conversions are not observed. They are estimated statistically and then reported as though counted. The estimate is not random, but it is not conservative either.
Pixel and CAPI deduplication. If you run the browser pixel and the Conversions API without a matching event_id on both, the same purchase gets counted twice on the same platform. Check the deduplication rate on your Purchase event in Events Manager. Fifteen minutes with a developer.
Sales tax. You collect it, you do not earn it. Shopify’s total sales figure includes sales tax and shipping revenue. Calculate MER on total sales and you are counting a state government’s money as your own. Net sales is the right default.
GA4 will not match. GA4 uses last non-direct click. Meta uses its own model. They are answering different questions and will never reconcile. Do not spend a week trying.
Frequently asked questions
Why is my ROAS good but my store not profitable?
ROAS measures revenue against ad spend only. It has no visibility into product cost, shipping, payment fees, discounts, or returns. A store can report 3.6 ROAS on Meta while its contribution margin after returns comes to less than the marketing spend that produced it.
What is the difference between ROAS and MER?
ROAS is reported by an ad platform and measures the revenue that platform believes it caused. MER is total store revenue divided by total marketing spend across all channels, calculated from your own data. ROAS is a channel diagnostic. MER is a business metric.
What is a good contribution margin for a jewelry brand?
Sterling silver D2C brands commonly run 45–60% contribution margin after product cost, shipping, payment fees, and discounts. Higher than apparel. But a high contribution margin does not guarantee profit — CAC, return rate, and overhead still decide the outcome.
How do I calculate my breakeven MER?
Divide contribution margin after returns by gross revenue to get your contribution rate. Add your ad spend and fixed overhead to find the contribution dollars you need. Divide that by your contribution rate to get the revenue required, then divide by ad spend. That is your breakeven MER.
Are returns really that expensive for jewelry?
Yes, and more than most owners model. Beyond the refund itself you lose outbound shipping, usually the payment processing fee, return shipping, and the labor to inspect, polish, and re-card the piece. For an $88 order at a 12% return rate, that runs about $23.85 per returned order.
Ashish Rai — CEO, Purple Circle
Ashish has spent over eight years in ecommerce, working with D2C brands on the side of the business most agencies never open: contribution margin, cash cycle, and what actually reaches the bank. Purple Circle is a performance marketing agency built around profit rather than reported ROAS.
At Purple Circle we calculate contribution MER after returns before we look at a single campaign. If your dashboards look healthy and your bank account does not, that number is usually where the answer is.