

$50K/Month in Revenue But No Cash in the Bank? Here’s Where It Goes
By Ashish Rai, CEO, Purple Circle · September 2026 · 6 min read
You did $50,000 in revenue last month. Your Shopify dashboard looks great. But when you check your bank account, there’s barely enough to cover next month’s ad spend and inventory. This isn’t a mystery — it’s a math problem. Between your gross revenue and your bank balance sits a stack of costs that your dashboard never shows you. Product cost, shipping, returns, payment fees, discounts, ad spend, and overhead eat 90–95% of that $50K before a dollar reaches your pocket. Here’s exactly where it goes, line by line.
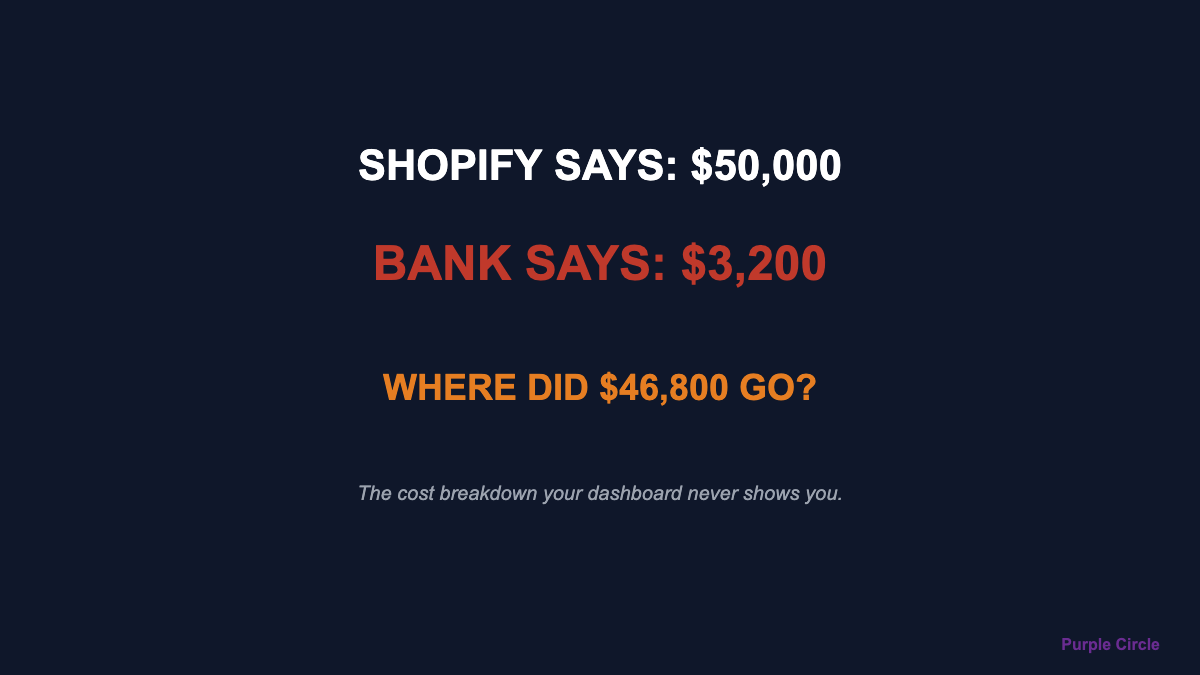
Shopify says: $50,000
Bank says: $3,200
Where did $46,800 go?
Every founder asks this. Almost none run the math to answer it.
The $50K revenue waterfall — what your dashboard hides
Here’s a real cost breakdown on a US D2C apparel brand doing $50,000/month with 600 orders at an $83 AOV:
| Where it goes | Amount | % of revenue |
|---|---|---|
| Gross revenue | $50,000 | 100% |
| Product cost (COGS 38%) | –$19,000 | 38% |
| Shipping + fulfillment | –$4,800 | 9.6% |
| Ad spend (Meta + Google) | –$12,500 | 25% |
| Returns (18% rate, net cost) | –$4,500 | 9% |
| Payment processing (2.9%+30¢) | –$1,630 | 3.3% |
| Discounts & promos | –$2,500 | 5% |
| Software + apps + overhead | –$1,870 | 3.7% |
| What’s left | $3,200 | 6.4% |
6.4% net margin. On $50K revenue, you keep $3,200. One bad month — a Meta CPM spike, a return surge, an aggressive sale — and you’re at zero or negative.
The 5 leaks eating your cash
38%
COGS
If your product costs more than 35% of retail, your margin can’t fund growth.
25%
AD SPEND
A quarter of revenue goes to Meta and Google before you see a dollar.
18%
RETURNS
Each return doesn’t just refund the sale — it costs you return shipping + product damage.
5%
DISCOUNTS
That 15% off popup eats a third of your margin, not 15%.
13%
SHIPPING + FEES
Fulfillment + payment processing. The “cost of doing business” nobody optimizes.
Why your ROAS looks great but you’re still broke
4x
What Meta reports
Gross revenue attributed. Before returns, before costs, before reality.
2.1x
Your real MER
Total revenue ÷ total ad spend. The number your bank agrees with.
6.4%
Actual net margin
$3,200 on $50,000. One bad month and it’s gone.
The gap between 4x ROAS and 6.4% net margin is where $46,800 disappears. Your agency optimizes for the 4x. Your bank only sees the 6.4%. This is exactly how stores with great ROAS still lose money — and why your agency’s ROAS screenshot means nothing.
The cash flow timing trap
Even if your unit economics are positive, you can run out of cash. You pay for ads and inventory upfront. Revenue comes in over 30–60 days. Returns hit 14–30 days after the sale. So the cash cycle is: spend $12,500 on ads in week 1, collect revenue in weeks 2–4, eat returns in weeks 3–6. The faster you scale, the wider this cash gap becomes. This is why CAC payback period matters more than ROAS — it tells you when your money actually comes back.
How to find your real number
The 5-step profitability audit
STEP 1
Net revenue
Gross minus refunds
STEP 2
Real MER
Net rev ÷ total spend
STEP 3
Per-order P&L
All costs, one order
STEP 4
Return cost
Per-return, not %
RESULT
Contribution margin
The real number
If the number is below 10%, scaling makes the hole bigger. If it’s negative, every dollar of ad spend is accelerating the loss. Fix the unit economics at current volume. Then scale. This is the same principle behind understanding your real breakeven ROAS — you need to know the floor before you push spend.
What changes when you fix the leaks
BEFORE
| Revenue | $50,000 |
| ROAS | 4x (platform) |
| Return rate | 18% |
| Discount depth | 15% |
| Repeat rate | 12% |
| Net profit | $3,200 (6.4%) |
AFTER
| Revenue | $42,000 (less, but real) |
| MER | 3.4x (verified) |
| Return rate | 11% |
| Discount depth | 8% |
| Repeat rate | 24% |
| Net profit | $8,400 (20%) |
Less revenue. 2.6x more profit. The $50K month kept $3,200. The $42K month keeps $8,400. Revenue is a vanity metric. Profit is the only metric that keeps the lights on.
$50K in revenue doesn’t mean $50K in the bank.
It never did.
We find where the money goes before we scale where it comes from.
Get a Free Profitability Audit →
Purple Circle — Profit-First Performance Marketing for D2C Brands
FAQ
Why am I doing $50K in revenue but have no cash?
Because 90–95% of gross revenue is consumed by COGS, shipping, ad spend, returns, payment processing, discounts, and overhead before it reaches your bank. Most dashboards show gross revenue, not what’s left after all costs.
What is a good profit margin for a D2C ecommerce brand?
15–20% net margin is healthy. Most US D2C brands run 5–10%. Below 10%, a single bad month can wipe out your profit entirely.
Why does my ROAS look good but I’m not profitable?
Platform ROAS measures gross revenue attributed by Meta or Google, ignoring returns, COGS, shipping, fees, and discounts. A 4x ROAS can easily be a 6% net margin once all real costs are counted.
How do I find out where my money is going?
Run a per-order P&L: AOV minus COGS, shipping, payment fees, ad cost (blended CAC), discount, and return cost. The number left is your real contribution margin — the only number your bank agrees with.
Related reads
- Why your store has great ROAS but still loses money
- Why your agency’s ROAS screenshot means nothing
- ROAS vs MER vs Blended ROAS
- Why your breakeven ROAS is higher than you think
- What is CAC payback period and how to calculate it
$50K/Month in Revenue But No Cash in the Bank? Here’s Where It Goes
Trusted by 235+ brands