

What Metrics Should I Actually Track in My Ecommerce Business?
By Ashish Rai, CEO, Purple Circle · September 2026 · 7 min read
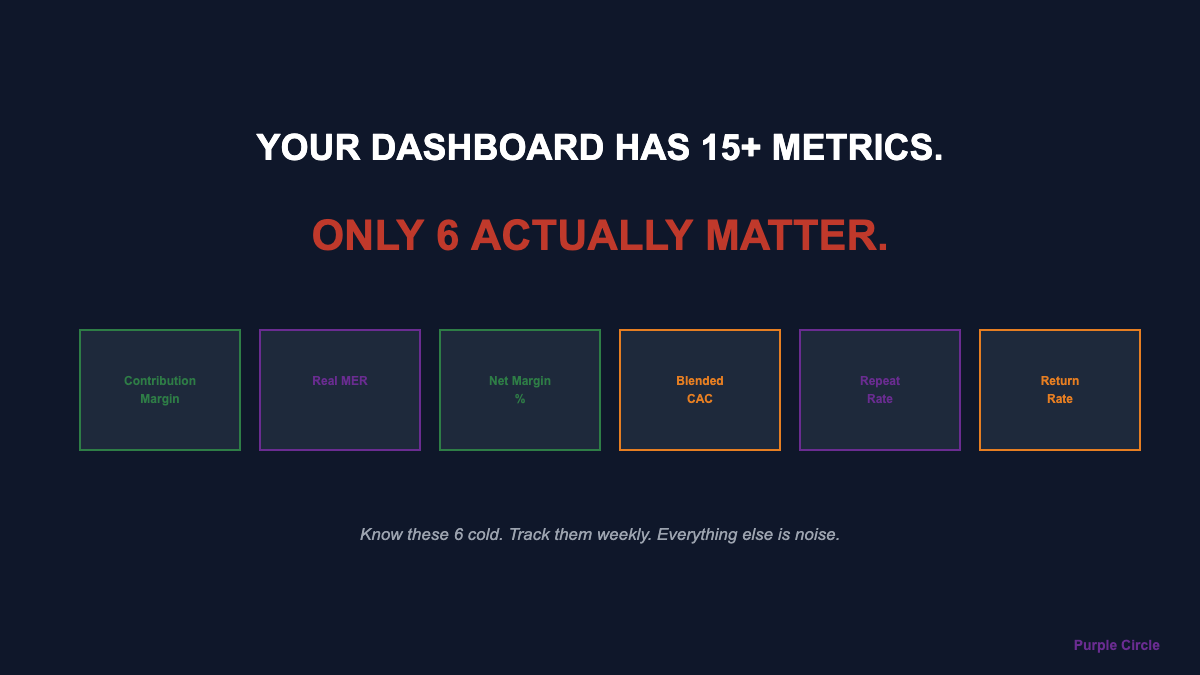
Most D2C founders track 15 things and understand none of them. They have a Shopify dashboard, a Meta ads manager, a Google Analytics report, and an agency spreadsheet — all showing different numbers that never reconcile. The result is decision-making based on whichever metric made the last week look good. Here’s the short list of metrics that actually matter, what each tells you, and the ones most founders track that tell them almost nothing.
Metrics your dashboard shows: 15+
Metrics that actually matter: 6
Metrics most founders track correctly: 0–2
More data doesn’t mean more clarity. It usually means more noise.
The 6 metrics that actually run a D2C business
| # | Metric | What it tells you | Healthy target |
|---|---|---|---|
| 1 | Contribution margin/order | What each order leaves after all variable costs | >$15–20 |
| 2 | Real MER | Blended ad efficiency across all channels | Above breakeven |
| 3 | Net margin % | What the business actually keeps | >15% |
| 4 | Blended CAC (net kept) | True cost per kept customer | <25% of AOV |
| 5 | Repeat purchase rate | Customer loyalty + LTV trajectory | >20% at 90 days |
| 6 | Return rate | Hidden margin leak + product-market fit signal | <15% apparel |
Every other metric either feeds into these six or is a vanity number. If you know these six cold — weekly, not monthly — you know exactly what’s happening in your business. If you don’t, you’re flying blind regardless of how many dashboards you have.
The metrics most founders track that mean nothing
❌ Platform ROAS
Measures gross revenue attributed by one channel. Ignores returns, COGS, other channels, and reality. Great ROAS and no profit is common.
❌ Gross revenue
What Shopify shows. Before returns, COGS, fees, ads, overhead. $50K revenue can leave $3K in the bank. Revenue is not the result.
❌ Sessions / traffic
Traffic without conversion context is noise. 10,000 sessions at 0.8% CVR is worse than 3,000 at 3.2% CVR. Volume is not value.
❌ Blended ROAS
Adds up what Meta claims + what Google claims. Double-counts the same sales. This is why your agency’s screenshot means nothing.
How to calculate each metric that matters
1. Contribution margin per order
AOV minus COGS, shipping, payment fees, blended CAC, and average discount depth. If this number is negative, every order loses money. If it’s thin, scaling loses money faster. This is the single most important number in your business — and most founders can’t tell you what it is.
2. Real MER (Marketing Efficiency Ratio)
Net revenue ÷ total ad spend across all channels. Not platform ROAS. Not blended ROAS. Net revenue after returns, divided by every dollar of paid media spend. This is the only metric that can’t be gamed by attribution. If MER is above your breakeven ROAS, you’re making money on marketing. If it’s below, you’re not. Track it weekly.
3. Net margin %
(Net revenue − all costs including fixed overhead) ÷ net revenue. Above 15%: healthy, can scale carefully. 8–15%: marginal, fix leaks first. Below 8%: raise prices before touching ad spend.
4. Blended CAC (net kept customers)
Total ad spend ÷ new customers who kept their order. Not platform-attributed CAC. If 100 ordered and 18 returned, you acquired 82 kept customers. Rising CAC is one of the earliest warning signs that your model is breaking.
5. Repeat purchase rate (90-day)
% of customers who made a second purchase within 90 days of the first. Below 15%: every sale costs full CAC forever. Above 25%: LTV is building and effective CAC is falling. This single metric separates brands that compound from brands that grind.
6. Return rate (by SKU)
Overall return rate hides the problem. Track by SKU. Almost always, 2–3 products drive 70%+ of returns. Fixing those SKUs — better sizing info, clearer photos, different positioning — improves margin faster than any ad optimization. Returns are a margin compression driver most founders track as an afterthought.
The weekly tracking rhythm that works
The 10-minute weekly review
MON
MER check
Above or below breakeven?
WED
CAC trend
Rising, flat, or falling?
FRI
Contribution margin
Per-order, this week vs last
MONTHLY
Net margin + repeat + returns
Full picture once a month
If you’re doing this and your six core metrics are healthy, scale. If any are broken, fix before scaling. This is the same framework behind knowing whether your D2C is actually profitable — not just looking profitable on a dashboard.
Stop tracking 15 things.
Start knowing 6 cold.
We build your weekly scorecard before touching your ad spend.
Purple Circle — Profit-First Performance Marketing for D2C Brands
FAQ
What metrics should I track for my ecommerce business?
Focus on six: contribution margin per order, real MER, net margin %, blended CAC (net kept customers), 90-day repeat purchase rate, and return rate by SKU. Everything else is either a component of these or noise.
What is MER and why does it matter more than ROAS?
MER is net revenue divided by total ad spend across all channels. Unlike platform ROAS, it can’t be inflated by attribution or double-counted across channels. It’s the only metric your bank account agrees with.
What is a good repeat purchase rate for D2C?
Above 20% at 90 days is healthy. Below 15% means every sale costs full CAC with no LTV building. Improving repeat rate is the cheapest way to lower effective CAC and improve net margin simultaneously.
Related reads
- How do I know if my D2C business is actually profitable?
- Why is my customer acquisition cost going up every month?
- I’m getting sales but my profit margin keeps shrinking
- Why your store has great ROAS but still loses money
- Why your agency’s ROAS screenshot means nothing
- $50K/month in revenue but no cash in the bank
What Metrics Should I Actually Track in My Ecommerce Business?
Trusted by 235+ brands