

Why Is My Best-Selling Product Not Making Any Profit?
By Ashish Rai, CEO, Purple Circle · October 2026 · 8 min read
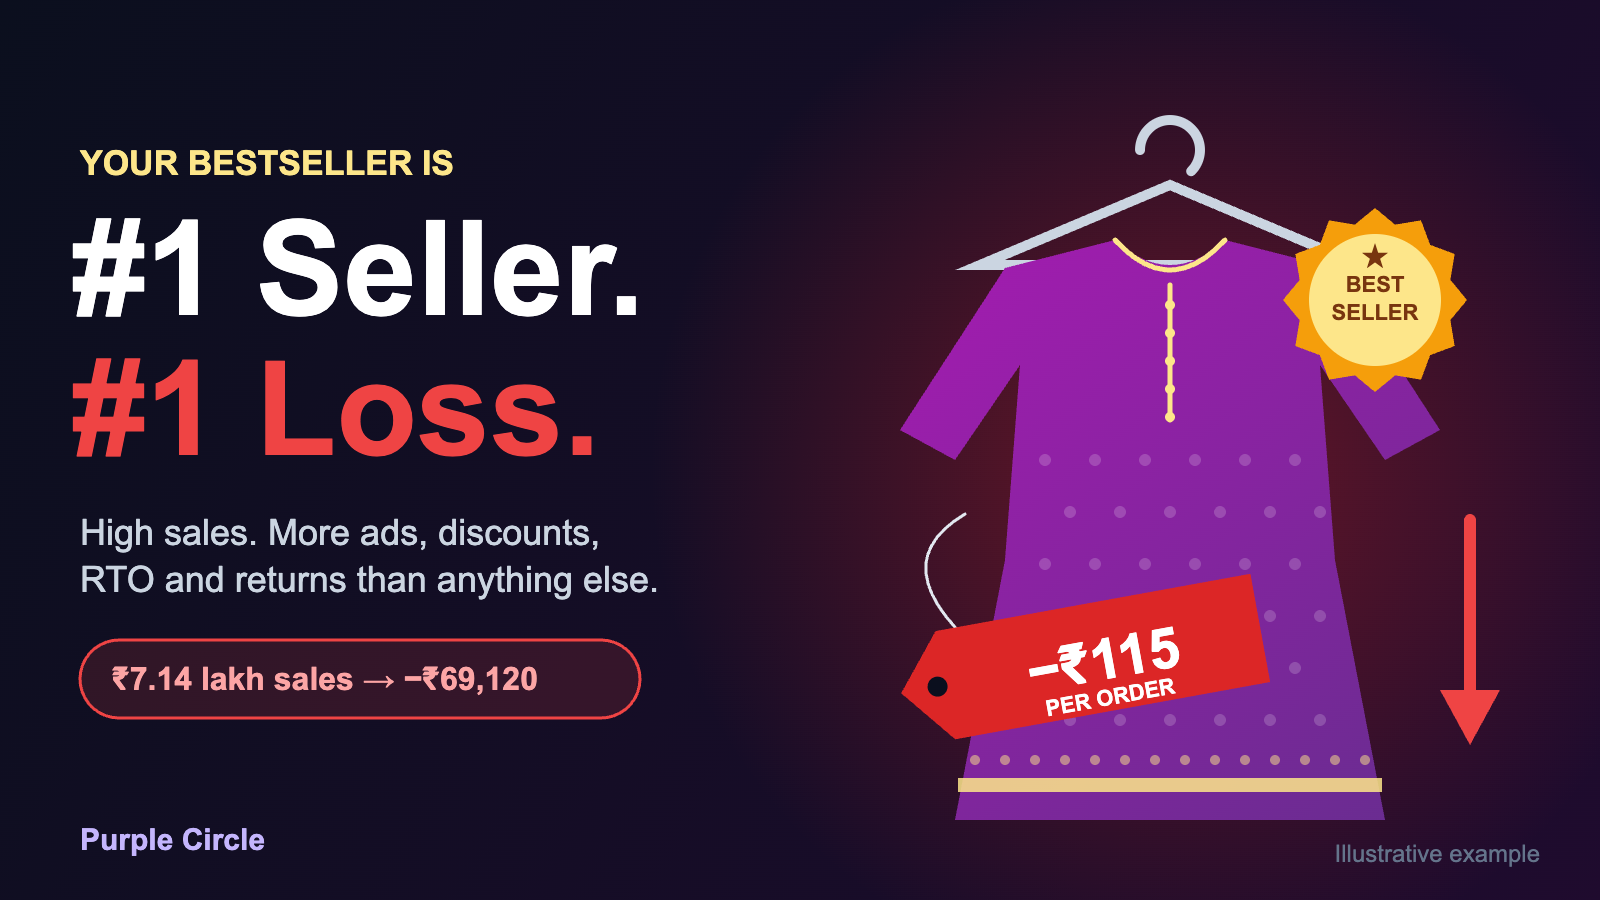
Your best-selling product often makes the least profit because it carries the most hidden costs: the most ad spend, the most discount codes, the most COD orders that come back, and the most size returns. Your sales report ranks products by revenue. Your bank ranks them by what is left after those costs. In the example below, a bestseller with ₹7.14 lakh in monthly sales loses ₹69,120, while a quieter product with ₹2.66 lakh in sales earns ₹53,960.
It’s one of the most common patterns in fashion D2C. The founder knows which product sells the most. Very few know which product makes the most. Those are rarely the same product.
Why the bestseller collects the most costs
A product doesn’t become your bestseller by accident. It becomes the bestseller because everything in the business starts pointing at it. And each of those things has a cost that never shows up in the product’s sales number.
On top of this, bestsellers usually leave behind size-wise dead stock: M and L sell out, and you are left holding S and XXL that you paid for and will later clear at a loss.
The math: two kurta sets from the same brand
Take an ethnic wear brand doing around ₹10 lakh a month. This is an illustrative example, not client data. Both products have the same list price (₹1,400 after GST) and the same product cost (₹450). Forward shipping and packaging is ₹100 on every order placed, the return leg on an RTO costs ₹80, a size return costs ₹100 in reverse pickup, and payment/COD fees average ₹30 per delivered order. Returned and RTO stock is assumed to go back on the shelf, which is generous.
One month, per product
| Line | Product A (bestseller) | Product B (quiet) |
|---|---|---|
| Orders placed | 600 | 200 |
| Average selling price after discounts | ₹1,190 (15% off) | ₹1,330 (5% off) |
| COD share | 70% | 40% |
| RTO rate | 30% (180 orders) | 12% (24 orders) |
| Size returns after delivery | 15% (63 units) | 8% (14 units) |
| Units the customer actually kept | 357 | 162 |
| Meta ad spend | ₹2,40,000 | ₹60,000 |
| Meta ROAS on orders placed | 2.98x | 4.43x |
| Sales shown in dashboard | ₹7,14,000 | ₹2,66,000 |
| Revenue actually kept | ₹4,24,830 | ₹2,15,460 |
| Product cost on kept units | ₹1,60,650 | ₹72,900 |
| Shipping, RTO and return legs | ₹80,700 | ₹23,320 |
| Payment / COD fees | ₹12,600 | ₹5,280 |
| Ad spend | ₹2,40,000 | ₹60,000 |
| Contribution for the month | −₹69,120 | +₹53,960 |
| Per order placed | −₹115 | +₹270 |
Product A brings in 2.7 times the sales of Product B. It also loses money on every order. Product B gets a quarter of A’s ad budget and is the one actually paying the bills.
Notice that Product A’s ROAS of nearly 3x doesn’t look like a problem on its own. That’s exactly why it goes unnoticed. ROAS is measured on orders placed, before the discounts, refusals and returns have happened. We covered this gap in detail in how RTO changes your break-even ROAS.
Where Product A’s ₹8.4 lakh of list-price sales goes
At list price, A’s 600 orders were worth ₹8.4 lakh. Discounts take ₹1.26 lakh, refused COD orders take ₹2.14 lakh of sales, and size returns take ₹75,000. Then ₹4.94 lakh of costs comes out of the ₹4.25 lakh that’s left.
How to find out which of your products actually make money
You don’t need software for this. You need one sheet with one row per product (or per style, if you have many sizes and colours) and a month of data.
Contribution per product, for the month
= Revenue from units kept
− product cost of units kept
− shipping on all orders placed − RTO and return legs
− payment / COD fees
− ad spend on that product
- Pull orders by product, including cancelled, RTO and returned orders. Your Shopify sales report hides most of these by default.
- Use the price the customer actually paid, after coupon codes and automatic discounts, not the list price.
- Match courier status to each order so you know the real RTO rate per product, not the store average.
- Assign ad spend to products. Catalogue campaigns report spend by product directly. For other campaigns, split spend by which product the ad features.
- Divide the result by orders placed to get contribution per order. This is the number that tells you which product to push.
Sort every product into one of four boxes
How to fix a bestseller that loses money
The answer is rarely “stop selling it”. A bestseller has proven demand, which is the hardest part. You just need to stop paying so much to sell it.
- Take it out of discount codes first. If it sells at full price, it doesn’t need the coupon. Even moving Product A from 15% to 5% off changes its result by about ₹50,000 a month in this example. See why a 25% discount can cut your margin by 66%.
- Fix its RTO, not the store’s RTO. Add a prepaid incentive or a small COD fee on this product, and verify high-risk COD orders before you ship them. More on this in how RTO is silently killing ecommerce businesses.
- Attack the size returns. Read the return reasons. Usually one size runs small or one measurement on the size chart is wrong. Fixing that one thing beats any ad tweak.
- Split your catalogue campaigns by profit. Build product sets by contribution, not by category, so Meta can’t keep pouring budget into the product that loses money.
- Test a price increase. Strong demand is exactly when you can afford a ₹100–150 price test. If conversion holds, the whole problem may disappear.
- Keep it as a loss leader only on purpose. If buyers of Product A come back and buy other products, a small loss on the first order can be fine. Check your repeat data before you assume this. Most fashion brands find it isn’t true.
Mistakes that keep the bestseller trap hidden
| Mistake | Why it hurts |
|---|---|
| Ranking products by revenue | Revenue rewards the product with the biggest costs. |
| Using store-average RTO and return rates | Averages hide the one product causing most of the damage. |
| Reordering the bestseller in the same size ratio | You buy the dead stock again, every season. |
| Letting one catalogue campaign decide budget | Meta optimises for sales, not for your profit. |
| Calling it a “hero product” without the math | Heroes that lose money just lose it at scale. |
If you want to check this at the store level first, start with how to know if your D2C business is actually profitable.
FAQ
Why is my best-selling product not making a profit?
Usually because it carries more ad spend, more discounts, more COD orders that get refused, and more size returns than your other products. Its sales look high, but most of that revenue goes back out as costs.
How do I calculate profit per product for my online store?
Take revenue from units customers actually kept, then subtract product cost, shipping on all orders, RTO and return shipping, payment fees and the ad spend on that product. Do it for one month, product by product.
Should I stop selling a product that loses money?
Not straight away if it sells well. Remove it from discounts, fix its RTO and size issues, test a higher price, and cap its ad budget. Cut it only if it still loses money after that.
Is a loss-making bestseller worth keeping to acquire customers?
Only if your data shows those customers come back and buy again. If repeat purchase is low, the “loss leader” is simply a loss.
How often should I check product-level profitability?
Monthly is enough for most brands. Check more often before and during festive season, when discounts, COD share and RTO all rise together.
If you’re not sure which of your products are actually making money, Purple Circle can review your product-level unit economics with you. You can also see how we work in our case studies.
— Ashish Rai, CEO, Purple Circle