
How Do Investors Evaluate a D2C Brand Before Investing?
By Ashish Rai, CEO, Purple Circle · October 2026 · 12 min read
Investors evaluate a D2C brand on whether each order makes money and whether customers come back, not on revenue alone. The usual checks are gross margin (around 55–75%), positive contribution margin after marketing, CAC payback within about 3–6 months, LTV:CAC of at least 3:1, rising repeat purchases, and a healthy share of sales on your own website. Since the funding correction, Indian D2C funding has roughly halved, so investors now back fewer brands, and the ones they back can prove profitable unit economics before they ask for growth capital.
💼 The 30-second version
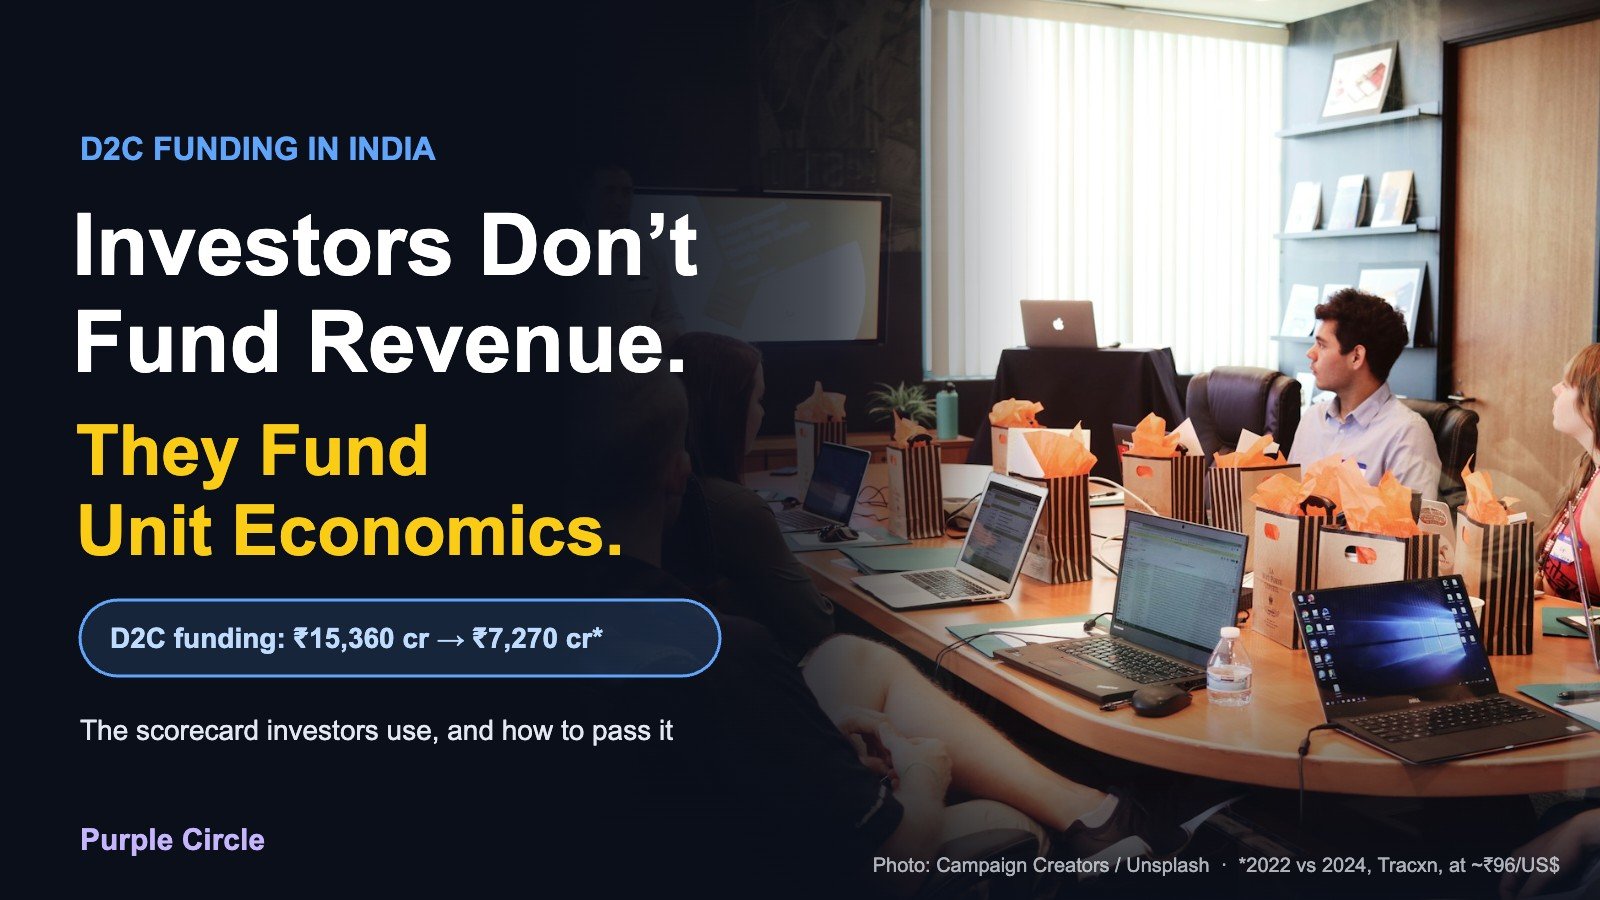
- D2C funding in India fell by more than half between 2022 and 2024. Money is scarcer and pickier.
- Investors look at margin, payback, repeat and channel mix before they look at growth.
- GMV, ROAS screenshots and follower counts don’t move a serious investor.
- Raise when the numbers are improving, with 12–18 months of runway, not when the bank balance is empty.
- Funding isn’t the only path. Debt, revenue-based financing and strategic sales are real options.
Every D2C founder has seen the LinkedIn posts: “Thrilled to announce our Series A!” What those posts don’t show are the dozens of pitch meetings that ended with “come back when contribution margin is positive”. In 2021, a growing revenue line and a good story could raise money. In 2026, investors ask the same questions a good CFO would, and they ask them in the first meeting.
The funding reality for Indian D2C brands
Indian D2C funding by year (₹ crore)
2022
2023
2024
Tracxn data ($1.6B, $930M, $757M) converted at about ₹96 per US dollar for comparison. Late-stage D2C funding fell about 50% in 2024 alone.
Source: Tracxn, via Entrepreneur India (about $6 billion, converted at ~₹96/US$).
Two things are worth noticing. Money hasn’t disappeared, but it’s going to fewer brands. And acquisitions now far outnumber IPOs as the way D2C investors get their money back, which matters when you think about who might fund you, or buy you.
Where Indian D2C brands get stuck
DSG Consumer Partners survey of 100+ Indian D2C founders and operators, as reported by Entrepreneur India.
The survey’s point is that demand isn’t the problem. How brands try to scale is. That’s exactly what investors are now testing for.
What investors check, and what they ignore
- Gross margin
- Contribution margin after marketing
- CAC payback period
- LTV:CAC ratio
- Repeat rate by cohort
- Channel mix and CAC by channel
- Burn and runway
- Founder’s grip on these numbers
- GMV before discounts and returns
- ROAS screenshots
- Instagram follower count
- “Viral” reels
- Revenue growth bought with ads
- Projections without proof
- Vanity awards
- “We’re like X, but for India”
DSG Consumer Partners has said publicly that it doesn’t look at GMV, because GMV hides discounts and returns. As one of its partners put it to Indian Retailer, “Consumer businesses do not scale like tech.” Fireside Ventures, which has backed brands like Mamaearth and boAt, looks for a real brand moat, not a business that only works while ads are cheap.
The investor scorecard
These are the benchmarks Indian D2C investors commonly use. They’re a guide, not a law. Investors adjust for category, stage and growth. Benchmarks as summarised by Base, with burn multiple from Eightx.
Green zone = where investors want to see you. Contribution margin should be positive, or have a clear path to positive.
| Metric | What it means | What investors want |
|---|---|---|
| Gross margin | Price minus product cost | 55–75% |
| Contribution margin | What’s left after product, delivery, returns and ads | Positive, or clearly heading there |
| CAC payback | Months to earn back what you paid to win a customer | 3–6 months |
| LTV:CAC | Lifetime profit per customer vs cost to acquire | 3:1 or better |
| Repeat rate | Share of customers buying again, often within 90 days | Rising cohort after cohort |
| Channel mix | Website vs marketplaces vs offline | 40–60% own website |
| Burn multiple | Cash burned ÷ new annual revenue added | Under 1.5x |
If contribution margin is a new idea, start with CM1, CM2 and CM3 explained. It’s the same number investors mean when they say “unit economics”.
Two brands, same ₹50 crore revenue: which one gets funded?
Here’s an illustrative comparison, not client data. Both brands do ₹50 crore a year. On a revenue slide, they look identical.
| Metric | 🚀 Brand A: growth at any cost | 🧠 Brand B: disciplined |
|---|---|---|
| Annual revenue | ₹50 crore | ₹50 crore |
| Gross margin | 58% ✓ | 66% ✓ |
| Contribution margin after ads | −6% ✗ | +18% ✓ |
| CAC payback | 14 months ✗ | 4 months ✓ |
| 90-day repeat rate | 12% ✗ | 31% ✓ |
| Sales on own website | 25% ✗ | 58% ✓ |
| Burn multiple | 3.0x ✗ | 0.9x ✓ |
| Investor verdict | Pass, or a tough down round | Term sheet |
Brand A isn’t failing on demand. It’s failing on how it buys that demand. Every extra rupee of revenue costs it money, so investor capital would just fund the losses faster. Brand B can show that more money produces more profit. That’s the whole pitch.
CAC payback, worked out in rupees
Say your average order is ₹1,499, each order leaves ₹600 after product, delivery and returns (before ads), and you pay ₹900 to win a new customer. Half your customers buy again within four months.
Recovering a ₹900 CAC, per customer (illustrative)
Day 0: you pay CAC
First order earns ₹600
~Month 4: half reorder, +₹300 average
Every order after this
CAC payback ≈ 4 months. If nobody reorders, payback never happens, and that is what investors are really checking.
LTV:CAC, worked out in rupees
24-month profit per customer vs ₹900 CAC (illustrative)
Grey = the ₹900 CAC. Same product, same CAC. Repeat purchases decide whether the customer was worth acquiring.
Your CAC depends heavily on how you budget ads. We cover that in how much to spend on Meta ads. Order value moves both numbers too. See why orders under ₹999 lose money.
Channel mix: why your website share matters
mix
Typical range investors look for, per Base. If your website makes 35% contribution margin but marketplaces make 8%, expect hard questions about how you scale.
Real example: Cava reportedly earns about 65% of revenue from its own website, and raised a ₹40 crore Series A in 2026. More on channel trade-offs in quick commerce vs your own website.
The D2C funding ladder
| Stage | What you usually need to show | Typical cheque / example |
|---|---|---|
| Friends, family, angels | A real product and early sales | Smaller cheques, size varies widely |
| Seed | Repeat customers, early unit economics | Commonly ₹2–10 crore for consumer brands, per FundTQ |
| Series A | Positive or near-positive contribution, scalable channel | Cava: ₹40 crore at ~₹5.5 crore monthly run rate |
| Series B+ | Proven scale, path to EBITDA | FableStreet: ₹50 crore Series B |
| Exit | A brand someone bigger wants | Snitch acquired Berrylush (2026) |
Ranges vary widely by category, investor and market conditions.
What a valuation multiple looks like, using Cava’s reported numbers
₹5.5 crore a month × 12 = ~₹66 crore annual run rate
₹215 crore valuation ÷ ₹66 crore ≈ 3.3x run-rate revenue
That’s in line with commentary that D2C valuations compressed from 10–15x revenue at the 2021–22 peak to roughly 2–4x. Margins and repeat decide where in that range you land.
How to get your D2C brand investor-ready
Funding options beyond equity
| Option | Good for | Watch out for |
|---|---|---|
| Bootstrapping | Full control. Forces discipline early | Slower growth, founder takes all the risk |
| Angel investors | Early money plus mentors | Messy cap tables if you take too many |
| Consumer-focused VCs | Large rounds, category expertise | High bar on unit economics, pressure to grow fast |
| Revenue-based financing | Funding inventory or marketing without giving up equity | Repayments eat cash flow if growth stalls |
| Strategic sale | A bigger brand buys you, as Snitch did with Berrylush | You give up control of the brand |
Red flags that end investor conversations
| Red flag | What the investor hears |
|---|---|
| Leading with GMV | “I don’t know my real revenue.” |
| ROAS as the main metric | “I measure ads, not the business.” |
| No cohort data | “I don’t know if customers come back.” |
| Most sales on discount | “Customers don’t value the brand at full price.” |
| “We’ll be profitable at scale” | “Your money will fund my losses.” |
| Raising with two months of runway | “I’ll take whatever terms you offer.” |
FAQ
How do investors evaluate a D2C brand?
They look at gross margin, contribution margin after marketing, CAC payback, LTV:CAC, repeat purchase rate by cohort, channel mix, and burn. Revenue matters, but only after these show that growth is profitable.
What is a good CAC payback period for a D2C brand?
Within about 3–6 months is generally seen as healthy. Over 12 months is a warning sign, because the brand needs a lot of cash to grow.
How much funding can a D2C brand raise at seed stage in India?
Seed rounds for consumer brands in India commonly fall between ₹2 crore and ₹10 crore, depending on traction, unit economics and category.
What valuation multiple do D2C brands get in India?
Commentary suggests D2C valuations compressed to roughly 2–4x revenue after the 2021–22 peak. Strong margins and repeat rates push brands toward the higher end.
Can a D2C brand grow without VC funding?
Yes. Many brands bootstrap or use revenue-based financing to fund inventory and marketing. Others grow to a size where a strategic sale becomes possible.
Preparing to raise? Purple Circle can help you get your unit economics, CAC and channel numbers investor-ready, and fix the ones that aren’t. You can also see how we work in our case studies.
— Ashish Rai, CEO, Purple Circle